by Gordon Scott
How market reactions in the year 2000 suggest what could happen in 2020
The current contentious election cycle in the U.S. has caused people all over the world to wonder what lies ahead for markets. Many investors wonder whether, if the 2020 election is not settled immediately after election day on November 3, U.S. stock market participants will react by selling shares to protect themselves from perceived risk. It is not idle speculation since markets have historically reacted negatively to political uncertainties in the past.
In the history of United States elections, there have only been four contested presidential elections. There have been many more elections that were extremely close, but only those four required serious governmental involvement of some kind. Three of those elections—1801, 1825 and 1877—occurred before the adoption of major market indexes to track stock market performance collectively in some way. The fourth was the 2000 election between George W. Bush and Al Gore.
KEY TAKEAWAYS
- Markets have historically reacted negatively to political uncertainties, including contested elections, in the past.
- Measuring from the start of September 2000 until one week after the Supreme Court decision on the contested election results in December 2000, the S&P 500 fell nearly 17.5%.
- During a hypothetical post-election period of contested results in 2020, it would not be unreasonable to forecast that the S&P 500 could drop similarly to its performance in 2000.
The 2000 Election
The 2000 election serves as an interesting template to gauge the measure of potential disruption the markets could face. However, it is important to point out that referencing a single data point is entirely anecdotal and unlikely to yield an accurate forecast for any market event, let alone the current election in such a tumultuous year as this has been. Caveats aside, there is some potentially interesting data to review by comparing both the price action in the S&P 500 Index (SPX) and the Cboe Volatility Index (VIX).
The importance of using the VIX as part of this comparison is this: the VIX literally tries to forecast the future. After all, options buyers are specifically trying to speculate on, or hedge against, future events they believe can strongly influence market prices. The calculation of the VIX is derived entirely from the prices of options on SPX—specifically the options that expire within the next 30 days. Therefore, by studying the price action of the VIX, we can discern what options traders believe the potential risks might be in the near future.
The translation of VIX pricing into movements of the SPX is not a simplistic calculation. The VIX is inversely correlated with the SPX, but only in a general way since option traders are essentially making bets on what they think might happen. That means the VIX can show dramatically more change than the corresponding and resulting SPX move might play out.
This was certainly the case at the start of the COVID-19 outbreak where the VIX reached levels close to those recorded in the 2008 financial crisis. Yet the S&P 500 Index did not fall anywhere nearly as far in 2020 as it did back then. In hindsight, it seems that option buyers initially overestimated the market impact of the pandemic.
Even so, the current movement of the VIX seems to be generating a surprisingly similar pattern to its movements before the 2000 election. Consider the following chart that compares these two indexes in the months surrounding the election and the contest that followed.
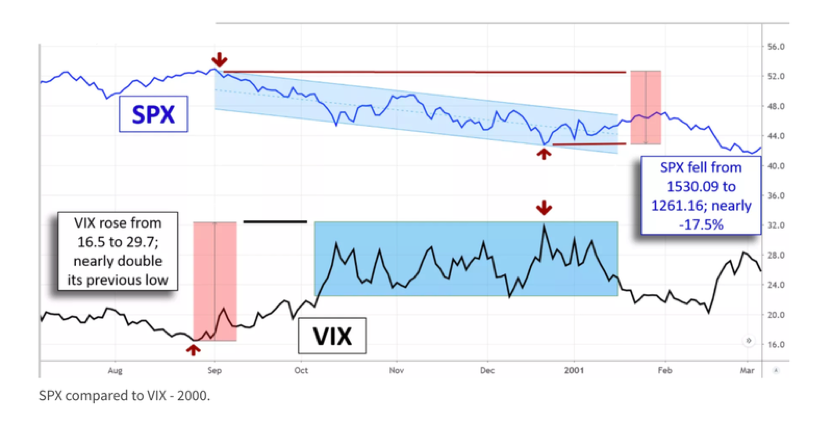
Notice that SPX was already trending lower that year. The technology sector cutbacks in the aftermath of Y2K had constrained demand for stocks. The chart shows a notable uptick in VIX activity through the month of September as the election drew near. Perhaps even more fascinating is how the VIX shot higher in early October and remained high all the way until the inauguration of George W. Bush (blue shaded area on the VIX line).
This dynamic in the VIX amounted to a move that nearly doubled its price even before the election had taken place. Measuring from the start of September until one week after the Supreme Court decision on the election results in December (marked by red arrows), SPX fell nearly 17.5%. Though the VIX spike coincided with the low point on SPX, most of that move was forecast by the initial moves of these indexes in mid-October, three weeks before the election took place.
Even though no one knew in October that the phrase “hanging chads,” would become so well-used in November, option buyers were preparing for the worst a whole month before. That may have more to do with the overall market and various economic dynamics at play that year than it did with election results specifically, but no one can say that 2020 isn’t rife with a similar collection of both political and economic concerns.
The 2020 Election
Chart readers like to boil down all the uncertainty in the markets into two-dimensional representations that focus on trending data. Doing so might make for a useful comparison to today’s circumstances as the following chart attempts to depict.
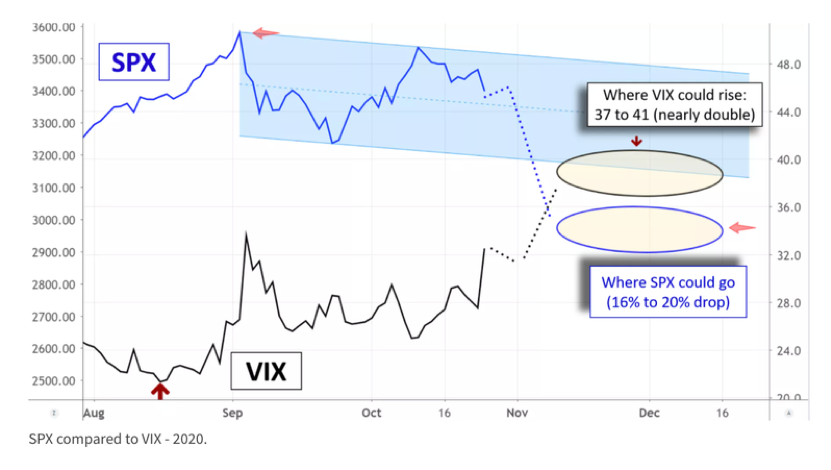
This chart was captured at the close of the markets on Monday, October 26. The market has been trending higher since April, but regardless of that difference, two important similarities jump out right away. The first is that the VIX made a similarly strong spike to begin a downward trend on SPX. The second is that, like the 2000 chart, the elevated level of the VIX remained in a higher range after its initial spike. In 2000, the VIX fluctuated in a level from around 22 to 32, while the current chart shows the index to be maintaining a range from 25 to 35—slightly higher than twenty years ago.
Consider that if the VIX, during a hypothetical post-election period of contested results, were eventually to spike to nearly double its starting level, it would not be unreasonable to forecast that SPX would drop similarly to its performance in 2000. There is no way to accurately know how low it would go and how long it would remain there. However, simply superimposing the movements of markets during the 2000 election forecasts a scenario that might be useful when planning for market risk.
Measuring a 17.5% drop from the initial high at the start of September could put the SPX below the 3000 mark. That’s at least a 10% drop from where it is currently trading as of this writing. Some investors might not be expecting that much risk, but apparently options traders have already priced in the possibility of such a move.
The Issue of Election Fraud
One important point to consider also is the impact of election fraud. It is likely that this topic will come up a lot during the coming weeks. Some investors may question if such discussions will have an impact on markets. Considering the topic in isolation, the answer to their question is likely, “no.”
The presidential election of 1960 between John F. Kennedy and Richard Nixon was decided by only 0.2 percent of the popular vote, and there was significant discussion about ballot fraud in Chicago and Texas. Most historians do not dispute that fraud could likely have occurred. However, they point out that it was unlikely to have changed the election results.
Meanwhile, the SPX jumped by two percent the day after Richard Nixon conceded, and the election marked a turning point in 1960 as 1961 went on to post strong gains. This price dynamic suggests that concerns over a tight election might have been holding the market back. It also shows that the most important factor in the results will likely be the orderly progression towards a decisive outcome, not the side issues trumpeted by either party. To the extent that there is continuing disruption of election results, there is an increasing likelihood that uncertainty will weigh on the markets.